Description
Violent Crime and Gun Violence
The City Controller’s Gun Violence Dashboard available on the office’s website presents detailed data on shooting incidents, using location and demographic insights to support citywide public safety strategies. Over the past decade, Philadelphia saw dramatic swings in shooting incidents, with sharp increases and decreases at both ends of the period. There were almost 17,300 shooting incidents from 2015 to 2025 with the highest annual amount recorded in 2021 at 2,331.
Between 2015 and 2021, the city saw shooting victims rise by 83%, with 506 fatal and 1,852 non-fatal victims. Since then, shooting incidents have steadily declined annually reaching a low of 979 incidents in 2025, marking an almost 60% decrease and the lowest number of fatal incidents recorded at any point over the last 10 years.
2015–2025 Gun Violence Victims
| Year | Fatal | Non-Fatal | Total |
|---|---|---|---|
| 2015 | 233 | 1,038 | 1,271 |
| 2016 | 262 | 1,055 | 1,317 |
| 2017 | 259 | 991 | 1,250 |
| 2018 | 302 | 1,135 | 1,437 |
| 2019 | 311 | 1,153 | 1,464 |
| 2020 | 449 | 1,796 | 2,245 |
| 2021 | 506 | 1,825 | 2,331 |
| 2022 | 476 | 1,779 | 2,255 |
| 2023 | 375 | 1,285 | 1,660 |
| 2024 | 228 | 854 | 1,082 |
| 2025 | 206 | 733 | 979 |
| Totals | 3,607 | 13,644 | 17,291 |
Non-Violent Property Crimes
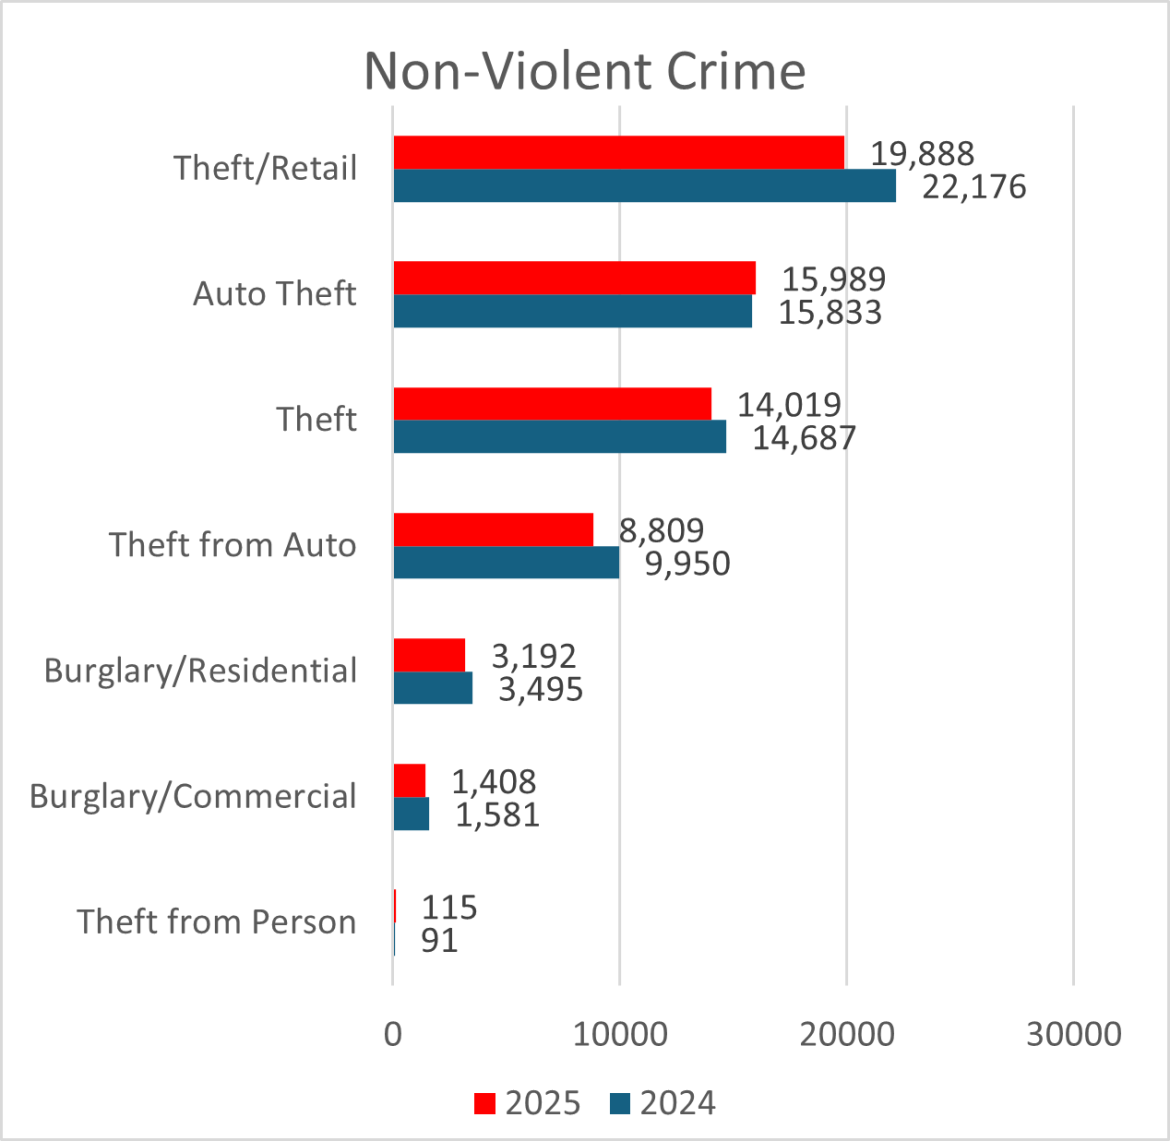
According to crime data maintained by the Philadelphia Police Department, the City experienced a modest but encouraging decline in non-violent property crime between 2024 and 2025.
Most non-violent crime in the city is theft from retail, recording 22,176 and 19,888 incidents in 2024 and 2025, respectively. Auto theft and general theft incidents were the second and third most incidents recorded over the last two years.
Overall, total incidents decreased almost 7% from 67,813 to 63,420. The decrease was driven by reductions in several major crime categories, including a 10% drop in retail theft, a 4.5% decline in general theft, and an 11.5% decrease in thefts from autos.
Public Safety Capacity and Building Safety
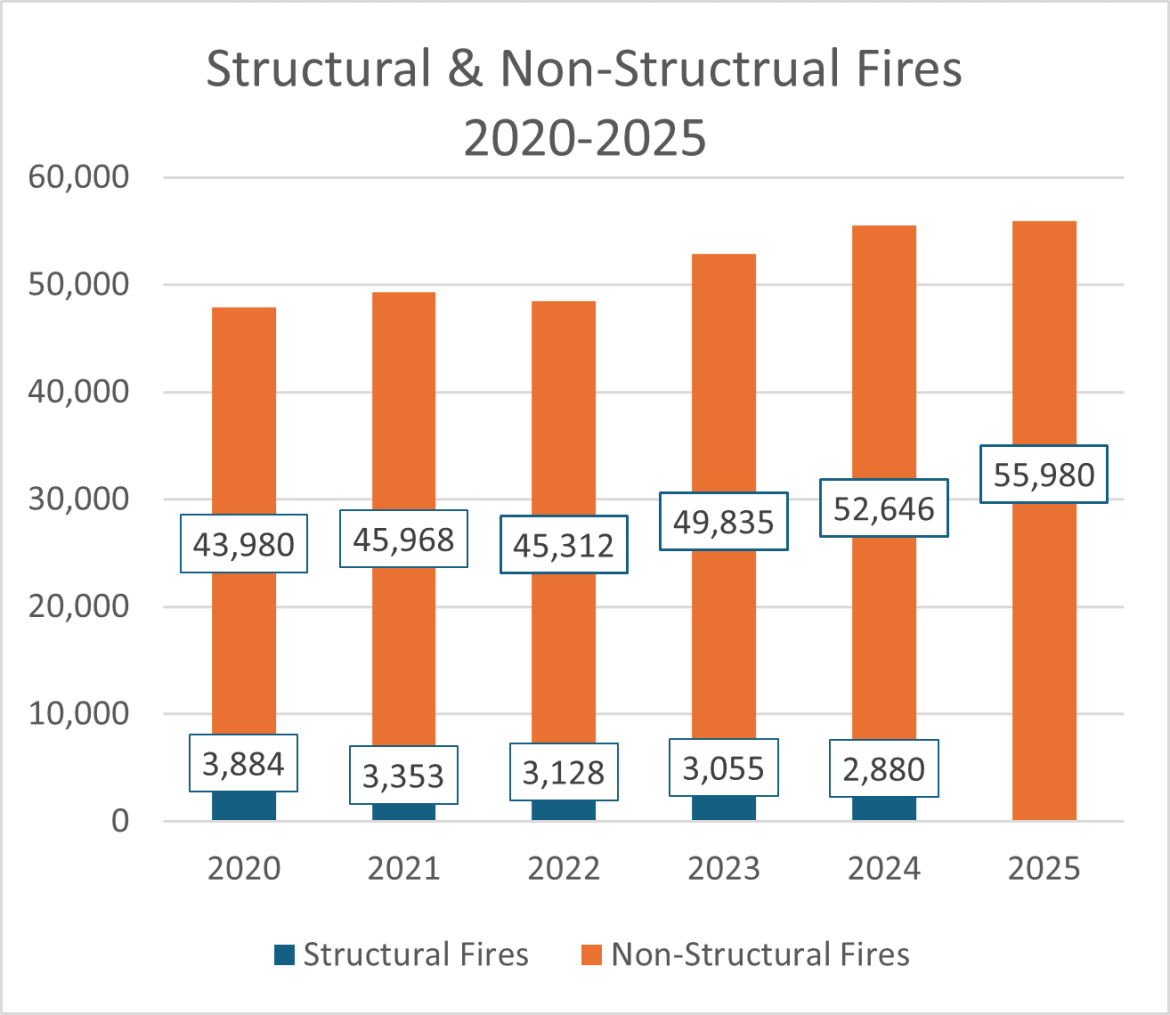
Since 2020, the City of Philadelphia recorded more than 310,000 fires, averaging about 51,600 annually. That’s around 141 fires a day, or a fire being recorded almost every 10 minutes. More than 90% of the fires are considered non-structural, which are fires that can damage the inside of a home or building but they don’t affect the structural core of it. Other examples can include rubbish fires contained in a bin or dumpster, chimney fires confined to the flue system, and outdoor fires started in grassy or wooded areas.
While total fires reported over the last six years increased by 17%, the total number of structural fires decreased by 26%1. Structural fires have greater potential for spreading and damaging the building itself, many leaving significant damage to the structure.
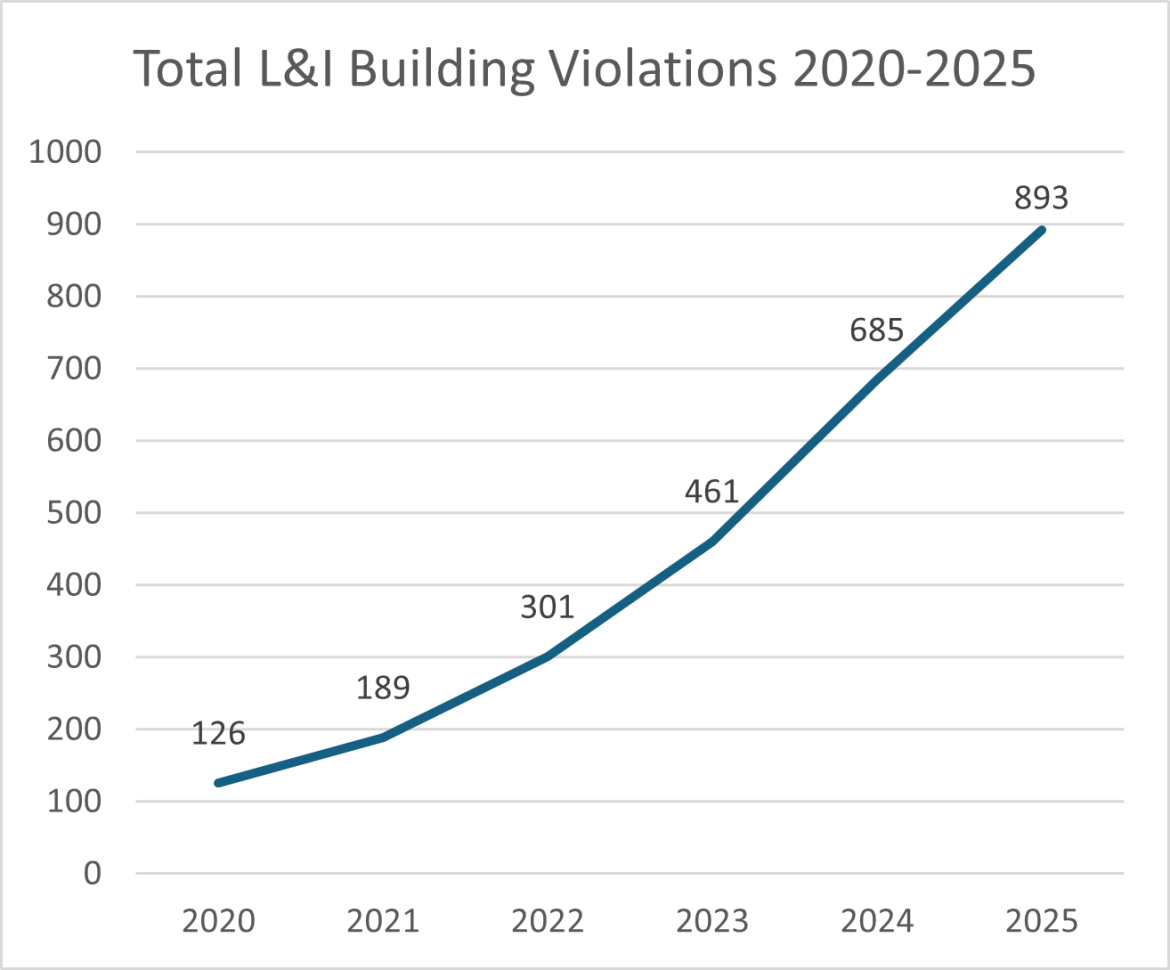
In addition to reviewing fire incident data, the Controller’s Office compiled statistics from the Department of Licenses (L&I) and Inspections and found a sharp rise in unsafe building violations issued since 2020. During this time, violations spiked from 126 to 893, marking a 600% increase. Based on L&I’s database, the lower number of violations issued between 2020-2022 is likely due to restricted activities during the COVID-19 pandemic. Violations increased sharply after the pandemic, with year-over-year growth. July 2025 recorded the highest monthly total, with 111 violations—nearly matching the total number logged in all of 2020.
Each month Controller Brady looks forward to bringing transparency and accountability of our city, right to you.
- 2024 is the latest year that structural fire data is available. 2025 data represents total fire incidents reported.