Nearly a year ago, the City of Philadelphia underwent its first citywide residential property reassessment since the Actual Value Initiative. The median assessment for single-family, residential properties increased by 10.5% for tax year 2019 over tax year 2018 values. This dramatic single-year increase in assessed value drew public criticism of the assessment process and the City office charged with completing them. Frustration has only grown in the months since, resulting in City Council commissioning a review of the Office of Property Assessment’s process and tax year 2019 assessments. The results of City Council’s review were released recently and raised many questions about an office and process that has real implications for Philadelphia families. It highlighted serious problems with the Office of Property Assessment (OPA), its assessments and its modeling practices. Moreover, the report detailed the OPA’s complete lack of transparency.
While our office did not verify or analyze City Council’s report, we identified similar findings in our independent analysis of the OPA’s assessments since 2014. This document serves as an overview of our analysis and findings, and the opinion of the Controller’s Office on how to improve the OPA and its assessments moving forward. A more in-depth, technical description of this analysis, as well as the data and software used to perform it, will be released in conjunction with this summary.
Methodology
To determine the accuracy and fairness of the OPA’s annual property assessments, the Controller’s Office conducted a citywide ratio study for each tax year since 2014 and compared our results with the OPA’s ratio study results, as reported to City Council each budget cycle. Ratio studies are the industry standard to evaluate the performance of an assessing body like the OPA. They compare assessments to real, market-value sales to ensure that models and procedures produce assessments that reflect actual market prices, regardless of a property’s location, size, or condition. Ratio studies determine two metrics: Coefficient of Dispersion (COD) and Price-Related Differential (PRD). The COD is a measure of uniformity, or whether like properties are assessed similarly, relative to their sales price. The PRD is a measure of regressivity, or whether less expensive homes are over-assessed relative to more expensive homes.
The most important step in a ratio study is determining which sales are reflective of market value and should be included in the study. For our analysis, we relied on the OPA’s verified market sales data for single-family homes and then followed guidelines set by the International Association of Assessing Officers (IAAO) for how to comb through data, properly select a sample of property sales, [1] and adjust for inflationary trends. We then calculated the COD and PRD for each tax year since 2014 to determine if the assessments fall within the acceptable range set by the IAAO. Failure to meet these ranges can indicate systemic flaws in assessment models and procedures. In a perfect world, our methodology would have mirrored the OPA’s; however, because the OPA is not transparent about its process, we were unable to do so. We believe that our methodology, using the OPA’s verified sales data and following the IAAO’s guidelines, was the fairest and best available option for our analysis.
Citywide Ratio Study Results
Our analysis indicates that the OPA’s assessments have improved year over year. However, we found that, historically, the OPA has not met the acceptable standards for uniformity or regressivity until tax year 2019. In previous years, our calculations diverged materially from the OPA’s numbers and the considerable difference between our historical results and the OPA’s self-reported historical results is problematic.
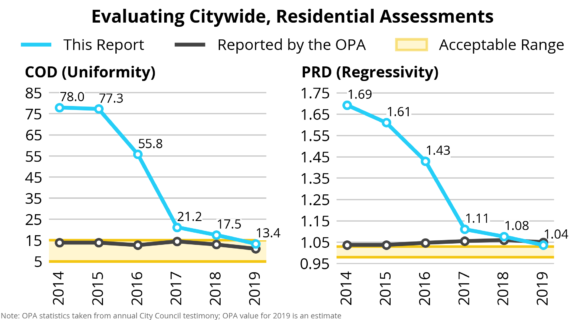
Due to a lack of transparency, we have no way of knowing how the OPA selected data for the purposes of its own ratio study, how it went about calculating the COD and PRD, or why our results, following IAAO industry standards, are so different. Our findings indicate that prior to tax year 2019, the OPA’s assessments were both non-uniform and regressive, despite the OPA’s claims otherwise. The OPA’s failure to meet IAAO-recommended guidelines calls into question the accuracy and fairness of its models to produce uniform assessments prior to tax year 2019. This undisclosed process is self-perpetuating: the OPA decides which sales are valid and which sales should be removed from the study and then evaluates how well they assessed the validated properties. Since they don’t publish the reasoning behind such decisions, it’s impossible to determine the reasons behind the differences between our findings and the OPA’s results. We surmise, based on our analysis, that the OPA is removing more sales from its study than IAAO guidelines recommend, which could be artificially improving OPA’s performance metrics.
Geographic Ratio Studies
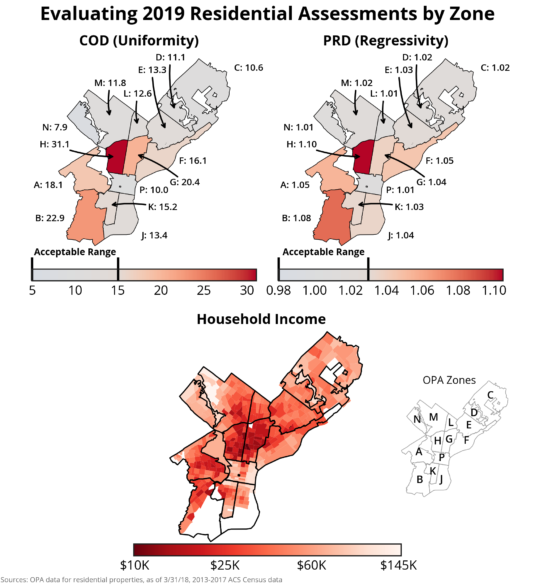
For a variety of reasons, properties with validated, market-value sales may still have assessed values that differ drastically from their sale prices. The IAAO provides guidelines for removing these problematic sales, known as outliers, from a ratio study. When conducting our citywide study of OPA assessments, we found that the outliers identified by these guidelines were geographically concentrated in certain areas of the city. The IAAO cautions that “if outlier ratios tend to be concentrated in certain areas or other subsets of the sample, they can point directly to systematic errors in the appraisal process.” Motivated by this, our office conducted separate ratio studies for neighborhoods across the city, using the 14 geographic zones set by the OPA to determine whether the OPA’s performance varied from place to place. We used the same methodology for each zone as we did for the citywide assessment. Notably, the areas of the city with a disproportionately high number of outliers in the citywide study were also the areas where the OPA performed worse in our geographic analysis. Excluding these outliers from the citywide ratio study produce more favorable COD and PRD values. Since many of these sales are included when evaluating the OPA’s performance on a smaller scale, geographic studies can point to assessment failures that a citywide study cannot.
The results of the zone-based analysis were troubling. Despite meeting IAAO standards in the citywide ratio study for tax year 2019, the OPA failed to meet them for 7 of 14 geographic zones. Our analysis also showed a strong relationship between regressivity and uniformity. The OPA does a much better job assessing properties in areas of the city like the far Northeast (Zone C), which has assessments that are more uniform and less regressive. The OPA is worse at assessing properties in West Philadelphia (Zone A), Southwest Philadelphia (Zone B) and North Philadelphia (Zones G and H), where assessments are more regressive and less uniform assessments. North, West, and Southwest Philadelphia, the areas with the least uniform and most regressive assessments in the city, are also the neighborhoods with the lowest median income in the city, ranging from approximately $18K in North Philadelphia to $26K in West Philadelphia according to 2017 Census data. This shows that the OPA does a worse job assessing properties in lower income areas of the city. And, that impacts residents in these neighborhoods: because their respective values exceed IAAO-recommended bounds, less-expensive homes in these areas tend to be over-assessed relative to more expensive homes. As higher assessments translate to greater tax burdens, residents in these areas are likely paying more than their fair share of property taxes.
Land Value
Philadelphia’s property assessments for single-family residential properties are comprised of a land value portion and a building value portion. In a properly functioning system, land and building values should be determined independently. Prior to tax year 2017, the OPA relied on an outside expert [2] on Philadelphia’s land values to provide land value estimates for properties across the city. This process resulted in land prices per square foot remaining consistent for properties in each other’s vicinity and overall land values that varied by lot size. For tax year 2017, however, the OPA changed its process for calculating land value, impacting nearly all residential properties.
In evaluating the 2017 land reassessments, our office determined that the land value for many residential properties depended on the total value of the property. Instead of identifying the true value of land from location to location on a per square foot basis, it appears that the OPA often applies a fixed percentage, typically 15% or 30%, of total value to determine land value. This means that if the OPA assessed a property’s total value at $100K, its land value portion was set at either $15K (15%) or $30K (30%). We found these fixed percentages in about half of all single-family residential properties (excluding condos) [3], whereas prior to tax year 2017’s reassessment, it occurred in only 88 properties citywide. This shows that land values are set not based on a property’s location or lot size, but rather using a method that lies outside the generally accepted best practices for land valuation. [4] It’s important to note that these findings do not necessarily translate to land values for vacant properties.
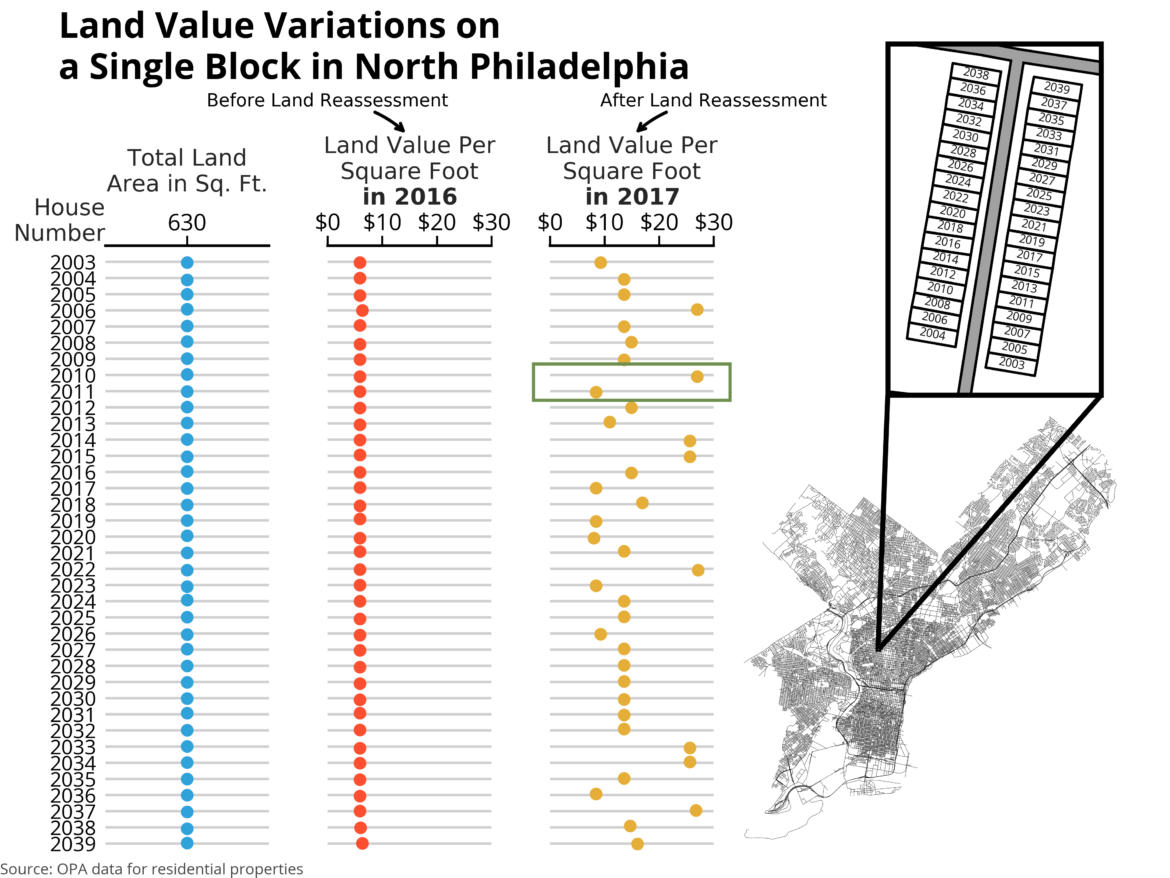
Overall, the tax year 2017 reassessment had implications for the relative uniformity of land values, resulting in large price discrepancies in land value on a per-square-foot basis for homes located on the same block. For example, the figure below represents an unidentified block in North Philadelphia made up of properties with identical lot sizes. In tax year 2016, the land values are as expected, correspondingly similar, but after the land reassessment in tax year 2017, the prices per square foot vary wildly. As highlighted by the green box in the chart, the variations were as large as $22 per square foot on the same block. It’s clear that the OPA’s new land value process is worse today than when it used an outside land valuation expert.
Following these land reassessments, the majority of property owners saw no change to their total assessment, because the OPA had merely transferred value from the building component to the land, or vice versa. Homeowners with a ten-year tax abatement felt these effects keenly. These property owners are exempt from paying taxes on some or all of their building value and pay taxes primarily on their land component. Whether a property has an abatement should have no bearing on the value of its land. Over short distances, such as a few city blocks, we expect land prices per square foot to remain relatively constant, regardless of an abatement. According to our analysis, this was the case prior to the tax year 2017 land reassessment. However, we see substantial differences between land valuation for abated and unabated properties, approximately $8 per square foot, beginning in tax year 2017. This trend has continued and grown over time. By our estimate, there is a difference of about $23 in the land values per square foot of abated and unabated properties on the same city block for tax year 2019. For the typical abated property with a land area of about 1,100 square feet, this difference corresponds to a $350 tax bill upcharge for abated properties.
Recommendations
In response to City Council’s report on the OPA’s assessment methodology and process, the Kenney Administration released a response and a list of recommendations to improve the OPA from a mass appraisal consultant. Our office agrees with the consultant’s recommendations, including improved data collection and application, expanded quality control measures and more. Additionally, we have a few recommendations that we believe will improve OPA’s process and strengthen the trust between the office and the public. While it appears that the OPA has improved year-over-year since AVI, its assessments on a geographical zone basis are problematic. The OPA should focus its time and resources on addressing its assessment shortcomings in the neighborhoods where it performs the worst. This includes areas of the city that show the greatest regressivity, like North, Southwest and West Philadelphia. Our analysis shows that these neighborhoods, also among the lowest income in the city, are overburdened as a result of OPA’s flawed assessments. While the OPA should diligently address inaccurate property assessments on an individual basis, it must also address geographical zone regressivity immediately. A timetable should be developed with a specific action plan for improving the assessments in each of the geographic zones in which it performs poorly.
Additionally, the OPA should prioritize resolving land valuation non-uniformity. While our office does not know the OPA’s exact methodology for setting land values, we do know that the lack of uniformity and the arbitrary nature of land valuations are unfair to residents. We strongly encourage the OPA to release its current process and models for land valuation, as well as maps of land values across different neighborhoods of the city. Whether the OPA decides to resume independent land valuation through a consultant or recalibrate its model for land valuation, one thing is clear: the OPA must improve uniformity of land valuations.
Tax year 2019 was the first citywide single-family residential property reassessment since AVI in tax year 2014. Governing legislation for AVI stated that the City should undertake annual reassessments of all property; however, that does not appear to have occurred. If it did, homeowners would see smaller, incremental changes in their property assessments year-over-year – changes that would mirror annual market trends – rather than dramatic single-year increases like tax year 2019.
Both the administration and City Council’s consultant reports suggested that the City could improve property valuations through the use of a Computer Assisted Mass Appraisal System (CAMA) program. We agree that CAMA will likely improve property assessments overall, but we caution in thinking that CAMA will fix all of the OPA’s problems. The root of the public’s frustration with OPA is its opaque nature. Many homeowners feel confused and unsure about the OPA’s modeling and assessment procedures, about how the OPA generates its assessments and how certain housing characteristics impact valuations, and how the OPA sets land prices. CAMA, a long-awaited measure first announced in 2013 that will likely improve property assessments, won’t resolve the transparency issue. Rather, Washington, D.C., a leader in assessment transparency, should be looked to as a model for Philadelphia in the future. Washington, D.C. publishes an annual report describing in detail each step of its appraisal process, including formulas and values for each type of property. The administration has stated that it intends to improve transparency through a public-facing component of CAMA. But, we strongly encourage the administration to think beyond checking the transparency box and develop a comprehensive information campaign to explain how the OPA does the important work of property valuation in Philadelphia before CAMA is implemented.
As the City of Philadelphia works to implement recommendations to improve OPA’s operations, it’s also a good time to address taxpayer protections. As property assessments increase, Philadelphians have seen their tax bills increase. The City implemented several protection measures to help mitigate the impact of assessment increases for owner-occupied properties – the Homestead Exemption, which reduces the taxable portion of a homeowner’s overall assessed value by $40,000 in tax year 2019, and the Long-Time Owner Occupants Program (LOOP), which protects homeowners who meet certain income requirements and residency requirements from paying the full-value of large increases. Taxpayer protections are critically important, but we should examine how they work and whether they are the best options for Philadelphians. In Boston, for example, the Homestead Exemption is tied to the average citywide assessed value, automatically increasing the Homestead Exemption with increases in assessed value. Other protections, like setting a cap on the growth of individual assessments, require authorizing legislation at the state level.
Lastly, as recommendations are implemented and the public begins to trust the assessment system, we recommend that the administration and City Council engage in broader conversations about tax reform. Philadelphia relies heavily on its business and wage taxes, the rates of which are among the highest in the country. The high wage tax is often cited as a cause for weak job creation compared to other cities, and multiple studies [5] have stated that Philadelphia should have less reliance on wage tax to spur business development. Assessment increases during periods of strong real estate growth in Philadelphia present a unique opportunity to shift more of the tax burden onto a transparent and fair property tax system and reduce dependency on business and wage receipts. Earmarking a portion of property tax revenue to implement more significant wage tax reductions would address a long-standing problem with the City’s tax structure while stimulating job growth.
Footnotes
[1] We include sales that occurred in the three-and-half years prior to the assessment certification date, with a 9-month delay. For example, the tax year 2019 assessments were certified in March 2018, and we include sales with dates between January 1, 2014 and June 30, 2017.
[2] “Property Assessment Methodology.” Office of Property Assessment, April 2013. https://bit.ly/2RKg8c2
[3] Multiple condos are typically found in the same building, making land valuation for these properties more difficult.
[4] “Traditional Methods and New Approaches to Land Valuation.” Lincoln Institute for Land Policy. July 2000.
[5] See, for example, the 2003 Tax Reform Commission (https://bit.ly/2TPeW4h) and the 2009 Mayor’s Task Force on Tax Policy & Economic Competitiveness in Philadelphia (https://bit.ly/2DdUhS3).